eCommerce analytics: What should you measure and why?
Imagine this.
Your site is online for a few months already. You log in to your computer and see that you have some new followers on Facebook and Instagram. Everything seems nice.
A few seconds later, you check if you have some new orders or not. Guess what – there are no new orders! But that doesn’t worry you. You’re getting new followers each day. Sales revenue will follow.
Chances for that to happen are not so big.
Your main goal with an eCommerce business is to generate profit. That alone is the reason why you shouldn’t be checking metrics that don’t have anything to do with your profit!
Aim of this article is to cover the topic of eCommerce analytics and provide you with useful examples and tips on how to measure your results – effectively!
We’ve talked before about the growing importance of mobile commerce nowadays and if you’re ready to meet your customers’ expectations – shoot us up! We’ll be happy to help you with developing your eCommerce app!
Where to start with eCommerce analytics?

Where should you start? It largely depends on whether you’re focusing on mobile users or web users.
For now, let’s talk about web eCommerce analytics!
One of the most basic concepts of web eCommerce analytics, which you may have heard of, is funnels. The idea behind the funnel is that your targeted prospect goes step-by-step through the funnel until they finish their customer journey.
We’ll show you an example of a funnel:
- A visitor lands on your homepage
- That visitor subscribes to your newsletter
- The visitor opens his newsletter, sees that you’re promoting a product and goes to the landing page through the email
- He then clicks on checkout
- He fills out all of the information and completes the purchase.
This is a simple example of one of many possible funnels. A certain percentage of visitors will drop out at each step of the funnel. If you take a deeper look into that percentage, you’ll already know where to focus your attention and which part of the process should you optimize.
Also, when you figure out which segment of your funnel is doing the best, or which channel is bringing you the most profits – it’s smart to implement growth hacking principles, in order to propel your store.
Now, when you have a grasp on what a funnel is and how it works, let’s talk more about metrics! We already mentioned them a few paragraphs before so let’s continue on that, shall we?
Metrics are one of the most important, if not the most important part of the whole analytics concept. You can gain a huge amount of data regularly, but if you’re not turning that data into useful information – it’s not helping you that much.
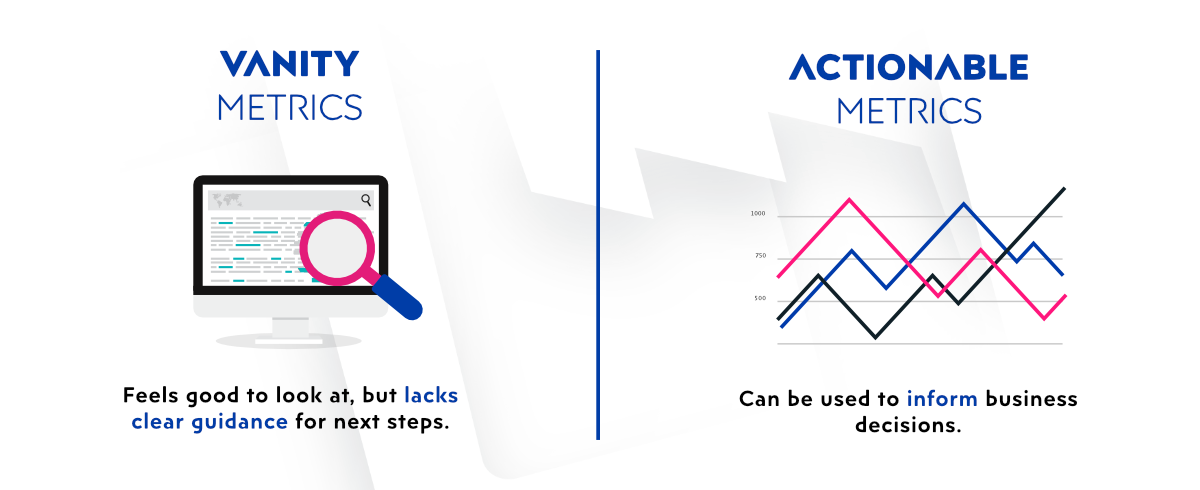
We’ll discuss two main types of metrics – useful metrics and vanity metrics.

Let’s start with vanity metrics.
Vanity metrics are generally the metrics we try to avoid, as they don’t show us anything in detail. In a way, the word “vanity” speaks for itself.
Some of the examples of vanity metrics are:
- Facebook page likes
- Number of website visits
- Amount of retweets on Twitter
You can already see where we are heading with this. It does look great when you have 40 000 website visits, or 30 000 Facebook page likes or 1000 retweets, but those numbers aren’t telling us anything important.
On the other hand, we have useful metrics!
What can you do with useful metrics? You can make data-driven decisions! They are relevant to your business.
Some of the examples of useful (actionable) metrics are:
- Conversion rate
- Average checkout price
- Customer acquisition cost
- Cart abandonment rate
The above named useful metrics are some of the most basic. Every eCommerce business should include them in their analytics.
Now that you know which metrics should you use and which ones you shouldn’t, there is also something as important as those numbers – knowing who your customers are!
If you’re looking for a high-quality eCommerce platform that can maintain
Get to know your customer
Now that you tell the difference between the vanity and useful (actionable) metrics, it’s time to look at the next big thing in eCommerce analytics.
Customers.
Everything revolves around your customers. Your business exists to solve your customers’ issues and make their lives better.
But what if you’re targeting the wrong audience?
Let’s take some time to reflect on this question. Imagine you’re selling hiking equipment. You wouldn’t want to target a senior audience that’s older than, let’s say, 55 years. Or someone who has no interest in hiking at all.
You need to know who you want to connect with.
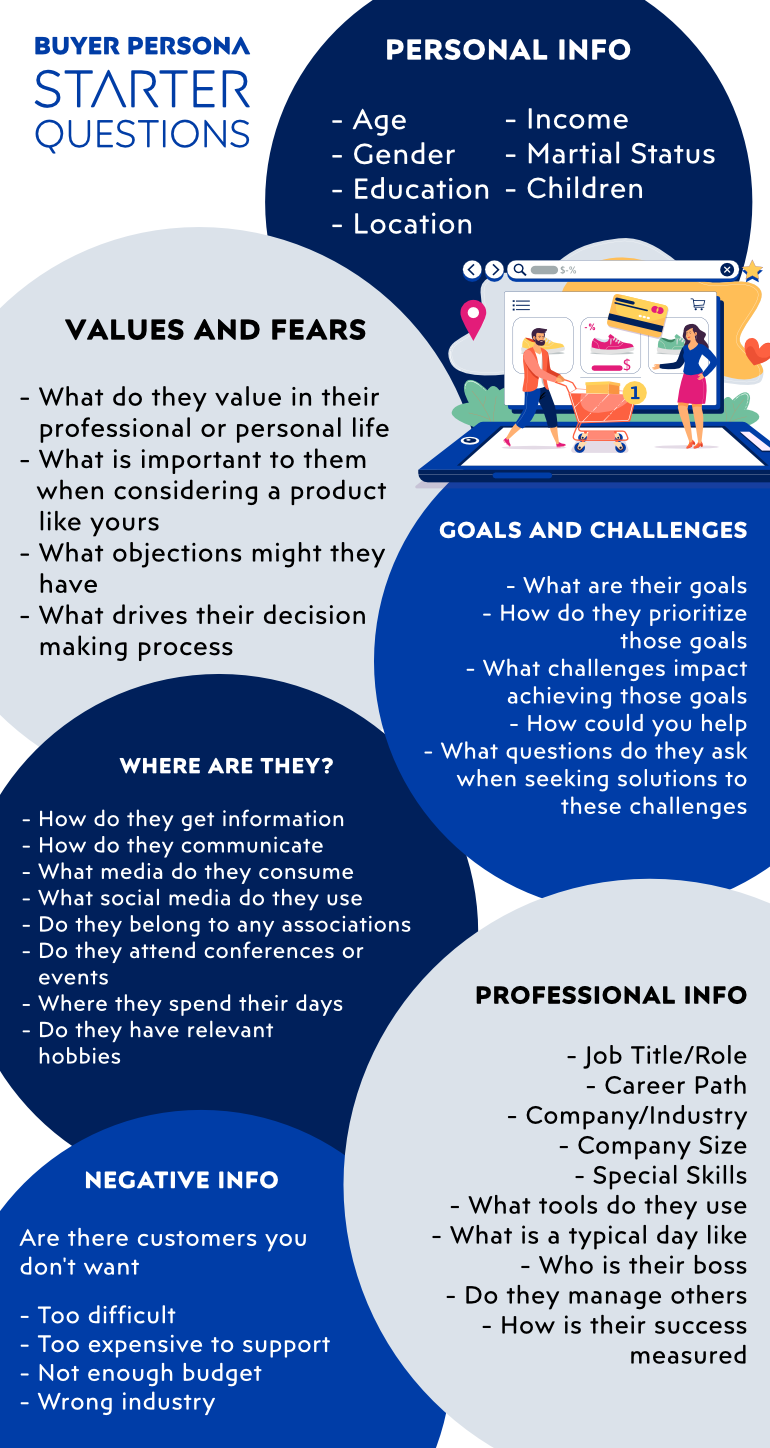
In order to get the maximum return on investment from your marketing activities, you need to build a targeted buyer persona.

According to Hubspot, a buyer persona is a semi-fictional representation of your ideal customer based on market research and real data about your existing customers.
When creating your buyer persona, consider including customer demographics, behaviour patterns, their motivations and their goals. The more detailed you are, the better.
Conversific wrote more about buyer persona – and it’s really good!
As they say – the best brands in the world know their customers so well that their marketing and advertising feels like a conversation with a friend rather than a sales pitch!
You experienced this quite a few times and you can agree.
In essence, for your customers to resonate with your brand – you need to know who they are.
Analyze your product portfolio
Why do you need to carry out product analysis?
There is a simple reason for that. It will give you an answer to some significant questions.
What kind of questions, you may ask. Let’s give some examples:
- Why is one product’s sales rising, while others are dropping?
- Which products should I feature as top products?
- Which products should I stop listing?
- When should I refill my inventory?
You can see that these are extremely important questions every eCommerce business owner should try to answer.
To get into product analytics, you should set some key product metrics. We’ll help you on that one and list a few (while avoiding the vanity metrics):
- Gross margin
- Number of product add to carts
- Product removes from cart
- Product conversion rate
We consider these metrics highly important and we’ll explain why. If you’re a product manager, you should track even more metrics!
Firstly, let’s see what is gross margin.
(Revenue – cost of goods) / Revenue = Gross margin
In essence, it’s the total percentage of revenue that you keep for yourself after a successful sale. Not that complicated, right?
Secondly, product add to carts.
As it says, product add to carts is a metric which displays the number of times a product was added to the shopping cart. The more, the better. By including this metric in your analysis, you can see which product is grabbing your customers’ attention.
Thirdly, product removes from cart.
This metric shows you the number of times the product was removed from the customers’ shopping cart. It’s a pretty useful one, as you can see which products are not performing as planned and what you should fix – for instance, product description, product images or something else product-related.
Lastly, product conversion rate.
This metric shows you the percentage calculated by dividing the number of purchases by the number of product views. The overall average product conversion rate in the retail sector is 3.0%, going from 1.4% in the consumer electronics industry to 4.9% in gifts industry.
All of these metrics are extremely important for every eCommerce business. If you’re an eCommerce business owner or you’re looking to start an anew in the eCommerce industry – this should be one of your core concerns.
Okay, now you know more about the metrics included in product analysis.
But how will this help you generate more sales? Don’t worry, we hear you!
- By executing product analysis, you can focus on winning products. You have all of the data concerning product sales in one place. You instantly know which products are performing better and you can focus on those products, instead of focusing on products which are not performing as good.
- Product analysis provides you with actionable reports that will help you make better decisions when it comes to sales, marketing and product development. Imagine, you have a product with 700 sales in 2 weeks and a product with 50 sales in 2 weeks (for example, 2 different pairs of shoes with a similar price). On which product will you focus your marketing and sales efforts? It’s a no-brainer.
- By analyzing your product portfolio, you’re able to segment your products. For instance, you can create segments such as “Fastest selling”, “Almost out of stock” or “Most refunded”. Segments provide you with more insight into how well your products are performing.
It’s all coming together now. But let’s think bigger. Let’s say you have an eCommerce website and you’re looking to launch an eCommerce mobile app for your business.
Now, this is where the fun begins.
You’re already handling all of the data for your eCommerce website and now you need to handle mobile app data too? If you want to propel your business forward – then yes.
eCommerce analytics for mobile apps

When analyzing your eCommerce mobile app, the metrics are mostly the same as they are for an eCommerce site. You’re measuring how well your products are performing, are your users satisfied and how profitable is this sales channel.
However, starting an eCommerce app may differ from starting an eCommerce website so take a look at our checklist for starting an eCommerce app.
Nevertheless, concerning analytics, there is a huge difference if you’re considering your mobile app to be the final product or you’re considering it as a communication channel between your business and your customers.
Let’s say that your mobile app is a communication channel. The number of mobile users is rising rapidly as mCommerce is taking over the retail sector and voice commerce is becoming more and more important. A significant number of users has switched to your mobile app and now – you need to choose what to measure.
Of course, gross margin, product conversion rate and such metrics are still extremely important.
There is no correct unique answer. Metrics you choose depend largely on your business goals.
You’ve probably heard of Business Insider. They have a mobile app which provides you with all the significant news in several categories, such as “politics”, “strategy”, “finance” and so on.
They also have a feature called Business Insider Prime. BI Prime is, in essence, another news category, filled with only the best articles, and it’s considered as a “premium” category of the app.
What do you think – which metrics should Business Insider measure for their mobile app?
They can measure:
- Number of app downloads
- Number of daily active users
- User growth rate
- Average revenue per user
- Return on investment
- Etc.
You get the point. It all depends on your business goals. But let’s head back and talk more about eCommerce mobile apps.
They are usually free. You can set a one-time fee for downloading the app, but what’s the point?
What’s awesome about mobile apps is that they serve you as a “free advertisement platform” (as long as you’re not overusing that option).
You can:
- Send push notifications to your customers,
- Notify them about your new deals, offers and products in-app,
- Create a special loyalty program for mobile app users
- Create promotional offers for mobile app users
The possibilities are endless. The main thing you need to do is provide your customers with the extraordinary customer experience and everything else should follow.
You’ve got more info now on what you should measure. The question you may be asking now is “Okay, I hear you, but what do we use to measure all of these metrics?”
Worry not, we’ll cover that in the next several paragraphs!
5 awesome tools for eCommerce analytics
We’ve handpicked for you some of the best tools for eCommerce analytics.
Without further ado, let’s dive in!
Google Analytics

Google Analytics is THE eCommerce analytics tool for any type of website. It does take some skill to use it effectively, but when you get past that – you can measure almost anything.
It has become a standard tool when it comes to web analytics due to the facts it’s free, easy to use and full of informative reports.
Regularly, Google Analytics is composed of 5 main different reports:
- Realtime
- Audience
- Acquisition
- Behavior
- Conversions
Every report is sewn together by several different reports and those reports consist of several more.
So, as we said, you can measure – everything.
Google Analytics indeed has many functionalities. Therefore, we’ll focus on a specific one – Cohort analysis.
Even though it’s still in BETA, it’s highly useful. Why is it useful, you may ask. Let’s make a quick overview:
- Through cohort analysis, it’s possible to see how much time is needed for your visitor to turn into a customer
- It’s possible to measure the success of your customer retention campaign based on data provided in the cohort analysis
- It provides insight into which product is performing better and is it creating one-time buyers or loyal customers
- Cohort analysis contains information on whether we should have a loyalty program or not
As you can see, it’s an awesome tool and the cohort analysis feature is one of the most useful (if you’re trying to get to know your customers of course.)
MixPanel

Following, we have MixPanel as one of the most advanced analytics solutions. Same as Google Analytics, it can be used for both mobile and web.
But where does it differ from, let’s say, Google Analytics?
MixPanel takes a different approach to web analysis. Most of the analytics platforms measure page views, for instance. You can do the same with Google Analytics, right? With Google Analytics you can actually measure whatever you want, to be exact – but MixPanel is a little bit more specific.
Some of the general MixPanel features are:
- Bookmarks
- A/B testing
- Visual coding
- Mobile surveys
- Retention features
- iOS and Android compatibility
- Customer engagement
And the list goes on. Truly a high-quality product.
MixPanel tracks events, creates funnels and spots trends. It’s more targeted compared to the other analytics platforms.
In essence, MixPanel is a platform where tracking doesn’t necessarily mean recording and analysing pageviews and clicks. It’s a platform that measures the events.
Okay, in this case, what can we call an “event”?
Events can be uploading an image sharing a post, streaming a video… You get the point.
Since every company has different business goals and needs, not every platform is going to be a match for them. If you’re thinking about MixPanel, first identify and evaluate your business needs.
Also, aspects such as finances, main features, worker’s skill levels and number of employees should be taken into consideration when choosing your analytics platform.
Without any further ado, let’s move on to the next tool!
Google Firebase

Yes, another Google product.
Let’s describe Firebase as simply as possible. Just as Google Analytics is important for websites, Google Firebase is important for mobile apps. Concerning analytics of course.
Firebase goes beyond the standard definition of an analytics tool. By using it, you can create ideal apps for your business. As it’s a Google product, it scales automatically to Google’s standards.
Firebase gives functionality to your app. You have insight into everything from analytics to databases, messages and crash reporting.
Firebase usually consists of a few parts. Main ones are Crashlytics and Google Analytics for Firebase. Crashlytics is an aspect of the platform which helps you track issues with your app and resolve those issues faster.
Now, the part we want to focus on is – Google Analytics for Firebase.
It’s a free mobile app analytics solution. It gives you insight in both your visitors and your app’s performance.
Using this solution, you can set up events that you want to observe and analyze. Here, we classify events as actions your users take in-app.
Why is this useful?
Well, it’s useful for one simple and crucial reason. To know what kind of app your users want, you need to understand how they are behaving currently in the app.
Which features do they like? Where do they spend most of the time in-app? What actions are they taking?
Those are just some of the questions you want and need an answer to.
When you’re using Firebase analytics, pay attention to these four:
- Audience – users segmented by characters and events
- Conversions – when users take a desired action
- Events – they are triggered when a user takes action in-app, it can be something like opening the app or visiting a certain page
- User properties – characteristics of your users, their hobbies, favourite colors, food, etc.
In any way, Google Firebase is definitely a go-to analytics tool for mobile apps. It will help you with both app maintenance and mobile app analytics.
Next tool we’ll highlight is…
CleverTap

This particular tool offers real-time customer insights, helping you to create marketing campaigns. It has the ability to create omnichannel campaigns based on insights from user activity. Omnichannel is a new trend currently. The idea behind it is to provide the best options to shoppers – every time and everywhere.
CleverTap is an example of an all-in-one marketing tool for mobile apps. That is thanks to the features of marketing analytics, marketing automation, mobile analytics, mobile marketing and push notifications.
It features a simple drag-and-drop interface which makes pinning, cloning or exporting any report to a custom dashboard very easy.
Segmenting users to create highly personalized campaigns is key to converting them into loyal customers. To help with this, CleverTap offers automated segmentation. You can segment your customers as champions, loyal users, at-risk users, and so on.
Pretty useful!
And it’s awesome to know that CleverTap is currently the only platform of that kind that uses AI and Machine Learning to personalize customer experience using real-time data.
Furtherly, to see how users are navigating the app and where they are dropping off, you can use funnels.
Why are funnels so important? Well, they can help us answer some crucial questions such as:
- Where are we losing most of our customers once they sign up?
- How long do my users take to upgrade?
- What do users do after adding an item to cart?
Funnels provide you with a visual overview of your customers’ behaviour. It’s a must-have feature nowadays for any analytics tool.
And now, the last tool we’ll talk about today is…
LeanPlum

Even if you have thousands and thousands of people who downloaded your app, that doesn’t guarantee you true mobile growth. Mobile growth comes from continual engagement and customer loyalty.
The focus of LeanPlum’s functionalities is on building strong customer relationships. Through cross-channel campaigns, LeanPlum unifies messages and in-app experiences.
Often, this makes you feel appreciated as a customer.
Let’s make an example.
You’re a music fan. You have several music apps on your phone because – why not? How else could you catch up with all your favourite artists?
Now, why would you choose one app over some other? It’s a pretty subjective matter, so let’s simplify this.
You would probably like to be notified of some new albums from your favourite artists. Or maybe a new song by an up-and-coming artist in your favourite genre?
LeanPlum features both outside-of-the-app and inside-of-the-app communication channels. In that case, you can be notified about this new album or a song via push notifications, email, webhook, in-app message, app inbox or some specific app function.
Now, not every first version of your campaign is successful. You can easily create variations of your campaigns and conduct A/B testing to create a winning campaign. The push notification campaign you sent about a sale may have increased your conversions, but at what cost? The cost may be seen as app uninstalls, for example.
LeanPlum offers you a 360-degree view of all funnels, campaigns and reports so you can run your campaigns confidently.
This was our quick take on eCommerce analytics tools.
It’s pretty clear that you will definitely need an eCommerce analytics tool in your business ventures. Structured and formatted information beats unstructured data – anytime!
Embark on your eCommerce journey
If you’re looking for a growing sector – eCommerce is your go-to.
Forecasts for 2021 say that the number of digital buyers will reach 2.14 billion people, almost one-third of the world’s population!
With new technologies, features and more and more digital buyers, we can say with confidence that eCommerce has a great future. If you feel like you still need to brush up your knowledge on eCommerce – we got you! We have assembled a list of 10 eCommerce blogs you should follow to stay in the loop. Also, take a look at our guide on creating a successful eCommerce app.
If you’re looking to ensure success for your eCommerce business, using analytics is crucial. Here at Factory, we’re always open to helping aspiring eCommerce businesses and developing eCommerce apps.
You need some help? Give us a call! We’ll be happy to help you out!
We hope this article was helpful and that we clarified some aspects of eCommerce and eCommerce analytics.


